BLOG
By Yasha Husain, posted May 14, 2009
Debate #2: Green Energy in the American Southeast
2.5 MW Liberty Wind Turbine with advanced variable wind speed controls
Photo Courtesy of Clipper Windpower/National Renewable Laboratory
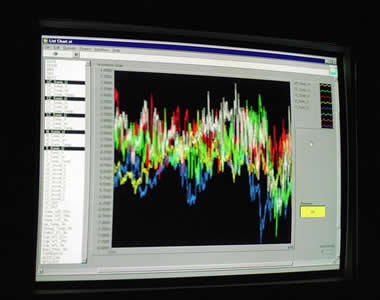
NREL real-time measurements of turbulent winds from five sonic anemometers
Photo Courtesy of Warren Gretz/National Renewable Energy Laboratory
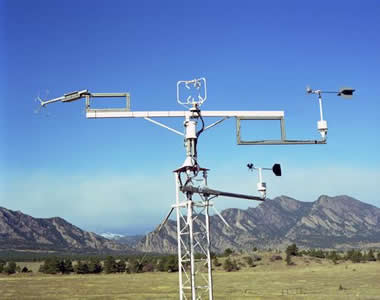
Wind Anemometers - PNNL improves cup anemometers to work more like expensive sonic anemometers (shown here)
Photo Courtesy of Warren Gretz/National Renewable Energy Laboratory
Todd Stone, Director of Marketing, 3TIER, Global Renewable Energy Assessment and Forecasting
Author's note: I was originally referred to 3TIER (and two other companies that focus on wind mapping, forecasting and consulting, AWS Truewind and Wind Logics) by a Senior Engineer at NREL who ran important studies on wind variability in test beds back in the 1990s. He helped realize the impact of redesigned turbines that take greater advantage of gains in wind speed, which mattered a lot since the power of wind is always proportional to the wind speed cubed. What that means is that wind energy is eight times as powerful when it is only twice as fast. Or, more simply put, wind power is much more potent at higher wind speeds. The wind turbines of the 1980s were built for constant speed. Newer turbines are built to take advantage of wind variability, or strong winds. (For reference, refer to The Power of Wind and also Wind Power Calculator.)
An issue that develops is the following, wind maps today are typically plotted using annual mean wind speeds determined by tools called anemometers used by meteorologists. Mean wind speeds unfortunately don't differentiate between more constant and variable winds. And locations with stronger winds part of the time may produce more energy than locations with more constant wind, but wind that doesn't tend to reach above a certain speed.Tools devised to get around the inconvenience of not having maps that paint a more detailed picture of a region's wind energy output potential at different times throughout the year are however being utilized, particularly by developers and people ready to make a large investment in wind energy production.
But it's in any case interesting to know the variability of wind in a region, as its speed changes from hour to hour and day to day, provides the most accurate picture of a region's potential for energy output.
Now, for my interview with Todd Stone of 3TIER, who, like the Senior Engineer at NREL, pointed me in a few directions I might not have thought to go.
“We’re really focused on helping people understand their renewable resources,” Todd Stone, Director of Marketing for 3TIER told me.
“We don’t consult," he said, but then quickly added, "given that, FirstLook (the mapping tool the company uses for prospecting) will give you average wind speed range, but that’s the tip of the iceberg. If you break it down you can see hourly wind speeds…Small increases in wind speed actually increase wind power significantly…There’s not a linear relationship between wind speed and power…It’s on a curve…(you can) look at the power curve, each turbine has its own power curve."
Using historical, meteorological data and integrating it with physical-based models of atmosphere and terrain interacting, 3TIER, as a part of their "REmapping the World" initiative, has created a 5 kilometer resolution global wind map which can be used as a prospecting tool for installers, developers, and producers. Those looking to develop renewables, who are interested in whether a location or set of locations have promising wind (and solar) resources, can use FirstLook to gain a better idea.
In fact, anyone can go to the company's website and for free, using the FirstLook mapping tool, look up annual wind speeds anywhere in the world. To get to the nitty gritty of the 'climactic modeling data,' however, requires becoming a paying customer. Also available through 3TIER is a database of power curves.
Customers, Stone recapped, can learn average wind speed each month of the year, each hour of the day, and the variability of wind over time, all derived from numerical weather prediction modeling. (For a complete listing of data that can be obtained log onto the FirstLook Report & Data page; data includes wind rose (drawn on the basis of wind speed and direction) and wind power capacity.)
The observational data used as inputs, he said, comes from a variety of places, including the Federal Aviation Administration and Department of Defense; and most of the modeling work is done with supercomputers. 3TIER takes the data it receives, and using the supercomputers, plots the results out on a map over ten, twenty, thirty, or forty years.
Utilities and energy producers will regularly use 3TIER's services for something called forecasting as well. PowerSight Forecasting relies on 3TIER's own forecast system, which "is a combination of publicly available weather forecasts, advanced statistical algorithms, highly customized mesoscale numerical weather prediction (NWP) models and self-learning artificial intelligence models. These models are combined with on- and off-site observations to generate both short- and long-term forecasts." The forecasting tool helps energy producers determine how much renewable power they'll likely add to the grid the next day (or the next hour), and how much dispatchable power, for example, from coal, hydro or nuclear plants, they'll draw down on or ramp up to balance their load. This is information they'll report to the local Independent Service Provider (ISO) that operates gridlines in the area (e.g. California ISO and ISO New England).
But for developers, Stone said, it's really the consultants who do more than just provide prospecting maps. Usually, he said, developers will bring consultants and 3TIER into the development process.
And consultants, it turns out, advise developers in a number of ways:
1) They offer their expertise in the field (i.e. knowledge of industry trends, wind turbine technologies, transmission and land use, power purchase agreements with utilities, and government policy).
2) They bring in computer simulated modeling, and look for extreme wind speeds (meaning the high wind speeds at which turbine energy output can be maximized, since too high of wind speeds cause turbines to shut down).
3) And, perhaps most importantly, they arrange field tests to obtain real-time data, usually early on in the development process. The tests are expensive (according to one consultant, the tests range from $30,000 to $100,000) and involve installing 30, 50, or 80 meter tall meteorological (met) towers, or masts, with 'guy wires' running to the ground, in one or several positions, depending on the terrain and environment. Quality anemometers can be placed at different heights along the towers.The 'met tests,' as they're called, are quite often run for a year, or two.
Two years, according to Roby Roberts, is preferable. "We've always found there's a lot more wind out there once you start poking around," he said. Roberts is Senior Vice President of External Relations for Vestas Americas. Vestas is the largest wind turbine manufacturer in the world, with 30 years in the business.
Earlier in his career, Roberts also served as President and was on the Board of Directors of the American Wind Energy Association. He mentioned in our brief phone conversation on May 12th that in the process of running met tests, consultants or developers will also scope out the terrain and atmospheric conditions of a proposed site, and seek a set of correlational data (as in from a nearby airport). They'll also take a look to see how the transmission in the area looks, to see if it is robust or congested.
As Stone put it, in the end, the consultants are the folks who say what energy applications would work best where. "3TIER provides a tool that makes a consultant's work easier," Stone said.
Roberts added that those developers who don't rely on consultants are generally the big firms that have the resources to handle most everything, the testing and site development planning, in-house. They may still require prospecting mapping tools from a company like 3TIER, however.
In Europe, Roberts commented, feed-in tariffs and regulations have made many small wind models viable, however the electricity prices are higher there too. Europe has taken advantage of low wind speeds more so than the United States, and many more residences there use small wind turbines, he said. The U.S., on the other hand, is focusing on driving the prices down. He added that another difference between Europe and the U.S. are the extreme wind speeds that you have in the U.S. that Europe doesn't have. For now, developers and their consultants in the U.S. are focused on larger wind energy models because of both costs and resources. (For details about the U.S. Department of Energy's plan to exploit the nation's wind resources read 20% Wind Energy by 2030, published in July 2008. And be sure to watch for updates regarding approvals to build offshore wind farms.)
In October of 2008, 3TIER introduced its first seamless solar mapping tool, which works a bit differently than wind mapping and is a less mature industry in this regard. While FirstLook wind mapping spans the globe, the FirstLook solar map covers the western hemisphere.Stone thinks as photovoltaics pick up this type of mapping will become more important, enabling people to forecast solar. "As solar accounts for a greater and greater percentage of the energy product portfolio there will be a need to forecast what your output from solar generation capacity will be," he said.
To create their solar mapping tool, 3TIER first obtains access to high resolution satellite imaging and then runs it through supercomputers to measure if there is cloud cover at any given point. It's run over 11 historical years.
As with wind, the most basic data on solar irradiation is available for free on 3TIER's website.
When I asked about potential difficulties in obtaining access to the more detailed wind and solar data if you're in a developing country, or a small-time investor in the United States, Stone remarked, “We’re giving away a ton of data, there have been debates about whether we give away too much."He mentioned that if the amount of data (that's free) helps get the ball rolling so that places like India can formulate policies and get the ball rolling there that at some point they will decide they want to move further.
When I asked if the company had worked directly with foreign governments he told me 3TIER has one project with a South American country that is soon to be announced. That country initiated the relationship, Stone said.
Finally, when I inquired whether in the future 3TIER would be able to offer a single mapping system that allowed its customers to view solar and wind resources side-by-side in a region, which would perhaps help developers consider the future potential of hybrid systems, he at first commented that solar mapping doesn’t involve numerical data, it uses satellite imaging. So, it’s kind of like comparing apples and oranges, if you look at the two that way.But perhaps the concept is already there, or getting there. Right now paying customers have access to detailed wind and solar maps of their regions of interest and less detailed maps are available to everyone for free. Maybe, in light of what I learned in relation to wind speed cubed and annual mean wind speed (which I believe much of the historical data pertaining to wind speed is based on), there should also be a clearer definition of the total utility of annual average wind speed (and diurnal or hourly wind speed) going forward for those who are just glimpsing the site.
It's generally thought a person doesn't need to run met tests or even do prospecting to install an individual turbine at a residence, but at the same time, wouldn't it be good if property owners and all people with a stake in a community understood better the nature of things like wind speed and variability, wind rose, turbulent wind, wind sheer and so on, in what is becoming an age of and for unprecedented growth in wind power.*
*Developers installing wind farms intended to be 20-year investments normally purchase turbines with rotor diameters and hub heights that exceed the sizes of most residential turbines. For more information about preferred small wind turbines visit NREL's Small Wind Turbines Independent Testing project page. Skystream also offers a popular small wind turbine that was developed in conjunction with the US Department of Energy.
*Article modified by Yasha Husain on May 18th, 2009 to include additional quotes from Roby Roberts of Vestas.
References:
DOE Scientific and Technical Information, Information Bridge. 5 Feb. 2008. Results from the NREL Variable-Speed Test bed. 01 Nov. 1997. <http://www.osti.gov/energycitations/
servlets/purl/563169-M5wjXl/webviewable/>.
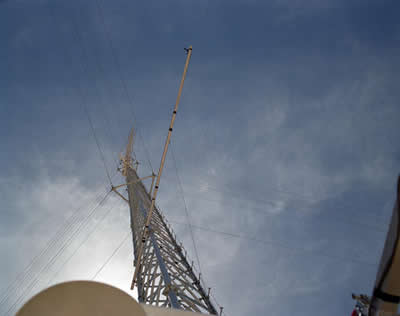
120-meter GE Wind Energy meteorological tower with GE Wind cup anemometer in foreground and NREL turbulence instruments installed above in the background, 2002
Photo Courtesy of Warren Gretz/National Renewable Renewable Energy Laboratory
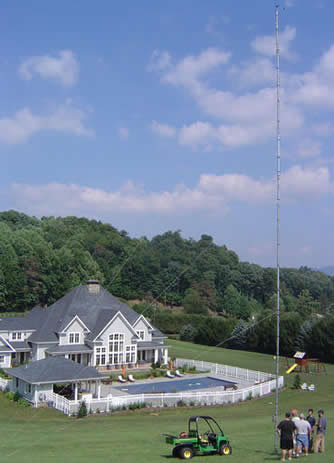
A team from Appalachian State University installs a wind mast, or tower, as part of the Western North Carolina Anemometer Loan Program for US Representative Heath Shuler at his home, 2007
Photo Courtesy of Appalachian State University/National Renewable Energy Laboratory
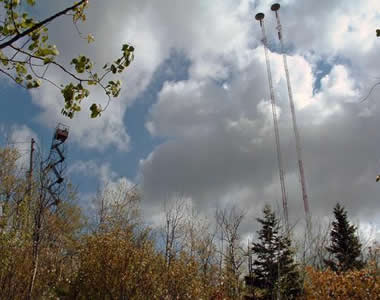
Anemometers mounted at Mount Maude on the Grand Portage Chippewa Reservation in northeast Minnesota at 20 meters (2004) on the fire lookout (left), and 30, 50, and 80 meters (2007) on TV towers (right)
Photo Courtesy of John Bray/National Renewable Energy Laboratory
_________________________________________
Robert Leitner, Director of South Carolina's Institute for Energy Studies at Clemson University
Nate Blair, Senior Analyst/Group Manager at National Renewable Energy Laboratory in Colorado
Jeffrey Nelson, Manager, Concentrating Solar Power Systems, Sandia National Laboratories
Fred Humes, Director of the Education, Training and Research Center at ARC: Hydrogen in Aiken, South Carolina
Erika Hartwig Myers, Renewable Energy Coordinator for the South Carolina Energy OfficeChris Daetwyler, Staff Specialist, South Carolina Hydrogen and Fuel Cell Alliance
__________________________________
Topics featured in this debate:
Offshore Wind
Concentrated Solar
Hydrogen from Solar Electrolysis
__________________________________
Debate #2: Comments
Received May 17, 2009 9:10 p.m.
James Hansen, "Hydrogen is not an energy source -- and not an effective energy carrier -- don't bet anything on it."
Hansen is Director: NASA Goddard Institute for Space Studies
Hansen's comments were the first to be posted for Debate #2; to view more comments, please link to the page, Debate #2: Comments.
______________________________________
Comments
If in response to Decision '09, The Science Debates you would like to have your comments posted, please submit them to yashahusain@gmail.com.